Network Model Scenarios
In the ever-evolving landscape of Passive Optical Network infrastructure, deploying the right FTTH architecture in the right environment is crucial. We have developed a modeling tool designed to streamline the decision-making process, offering a comprehensive comparative analysis that applies various FTTH network architectures to diverse deployment environments, ranging from high density urban environments through to low density rural areas.
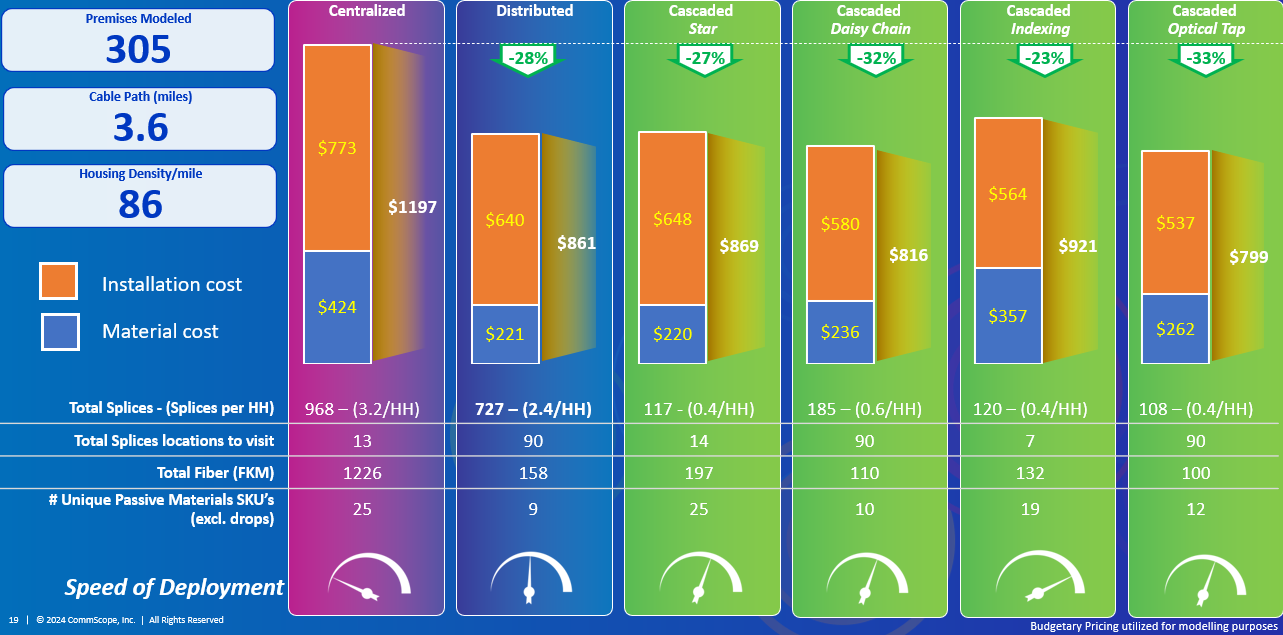
This comparative analysis takes three distinctly different deployment environments, overlaying six different FTTH network architectures to compare the differences in material and installation costs, providing a holistic view that empowers decision-makers to optimize their network strategies.
Model Assumptions
High Level Assumptions:
- 100% Aerial
- Gehärtete verbindungen
- Terminal port count and location kept consistent
- Pre-terminated drop cables and demarcation box
- 50% upgrade to Poles and Strand (Make ready)
- Allocation for 7 miles of F1 plant included
Labor Rate Card Utlized For Modeling:
- Splice Cost - $38/splice
- Cable Lashing - $2.50/ft
- Mid-sheath opening FOSC - $195/ location
- Mid-sheath opening OTE - $90/ location
- Permitting allocated at 174 hours (1 month) - $120/hour
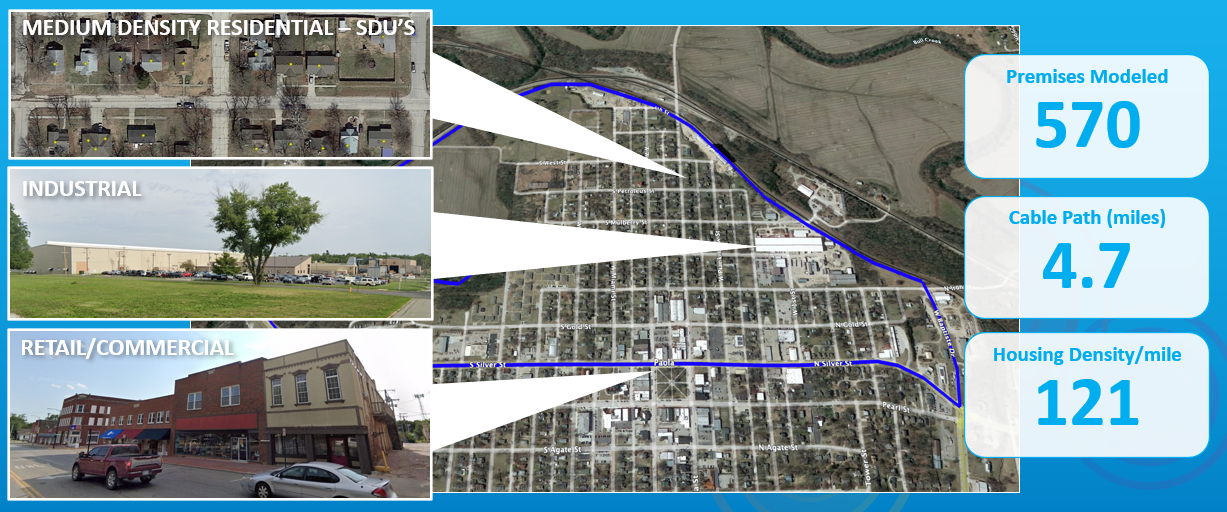
Township Model - Network Topology
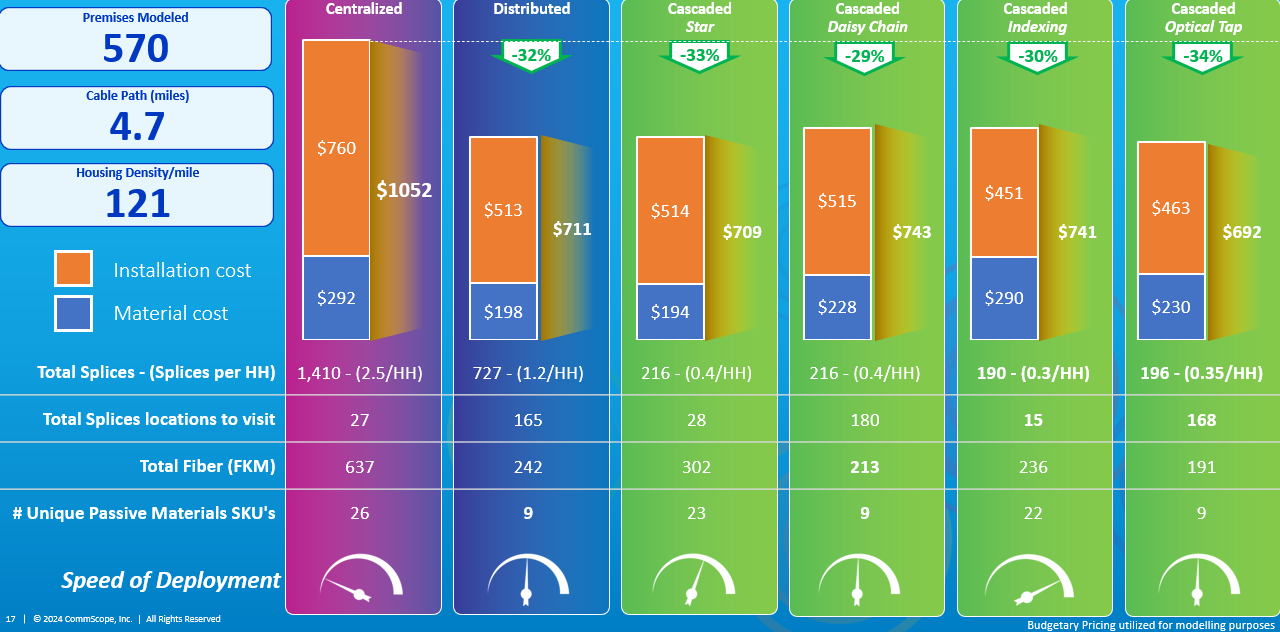
Township Model - Network Comparison
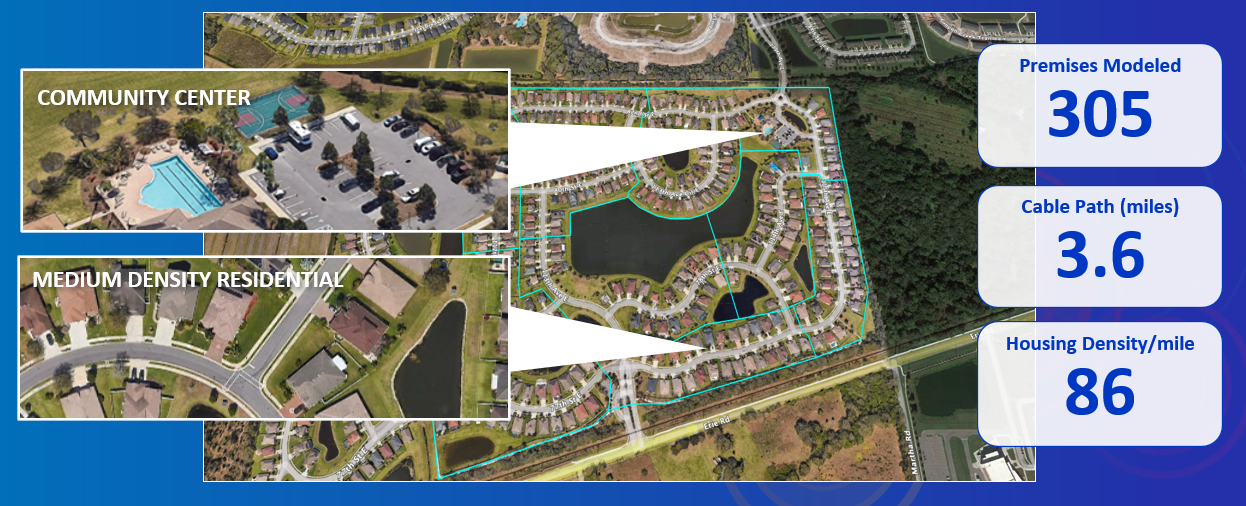
Subdivision Model - Network Topology
Subdivision Model - Network Comparison
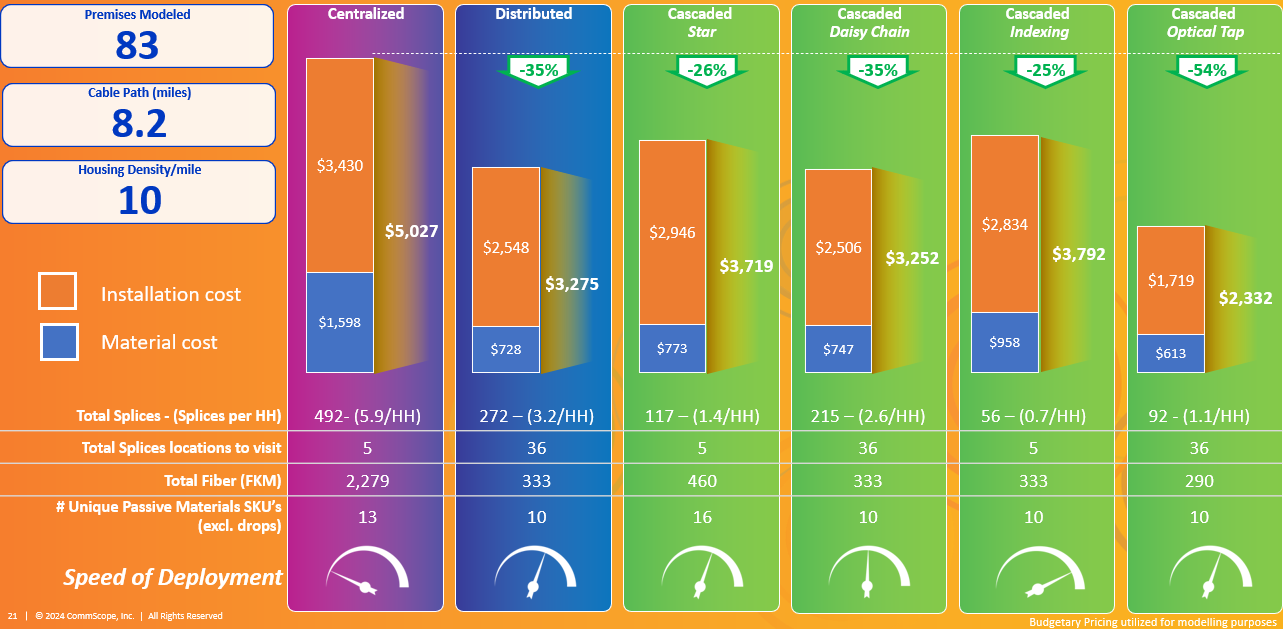
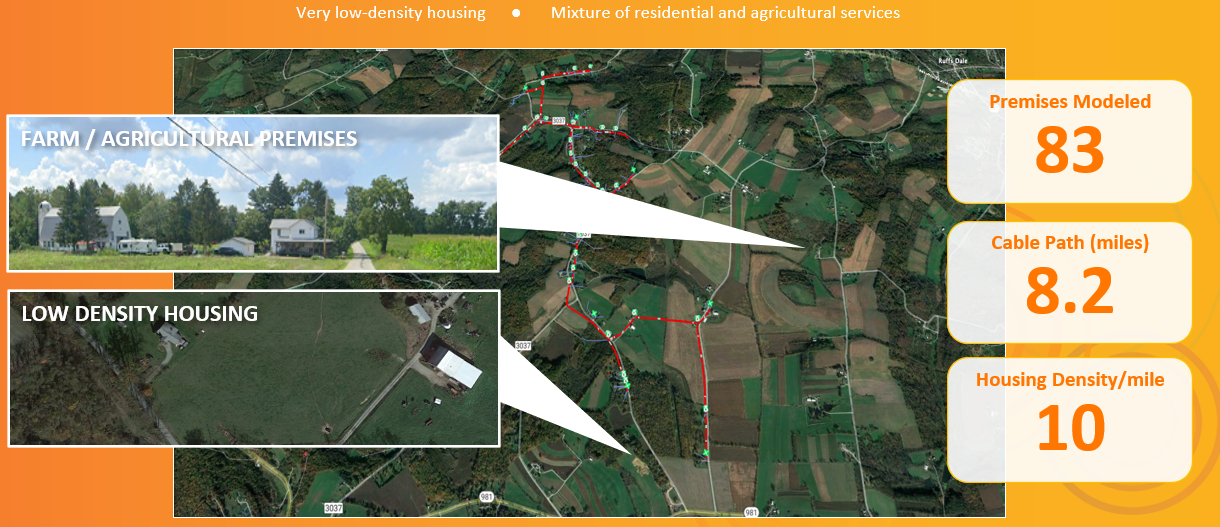
Rural Model - Network Topology
Rural Model - Network Comparison